Skip to content
Monday, August 18, 2025

NAP Readiness Project

NAP Readiness Project

  • About
    • About Project
    • Consultants
      • National
      • International
    • Partners
  • Activities
    • Federal Activities
    • States Activities
  • Documentation Library
    • Reports
    • Maps and Figures
    • Related Studies
  • Gallery
  • State Level
    • West Kordofan
    • South Kordofan
    • North Kordofan
    • El Gaziera
  • M&E
  • Contact Us
You are Here
  • Home
  • Maps and Figures
  • Page 6

Category: Maps and Figures

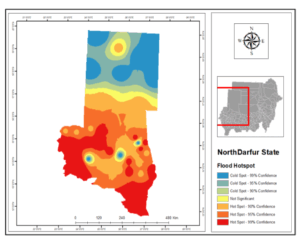
Floods Risks and Floods Hotspot Maps Maps and Figures

Fig 10.b Flood Hotspot in North Darfur State North Darfur

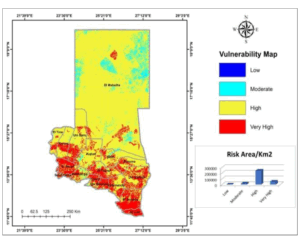
Floods Risks and Floods Hotspot Maps Maps and Figures

Fig 10.a Flood Risk in North Darfur State North Darfur

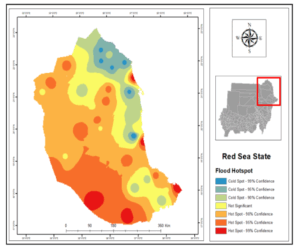
Floods Risks and Floods Hotspot Maps Maps and Figures

Fig 9.b Flood Hotspot in Red Sea State The Red Sea

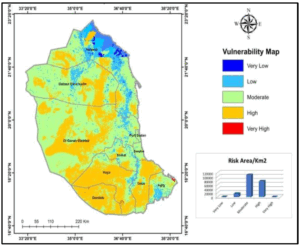
Floods Risks and Floods Hotspot Maps Maps and Figures

Fig 9.a Flood Risk in Red Sea State The Red Sea

Floods Risks and Floods Hotspot Maps Maps and Figures

Fig 8.b Flood Hotspot in Gadarif State Gadarif

Floods Risks and Floods Hotspot Maps Maps and Figures

Fig 8.a Flood Risk in Gadarif State Gadarif

Floods Risks and Floods Hotspot Maps Maps and Figures

Fig 7.b Flood Hotspot in Kassala State Kassala

Floods Risks and Floods Hotspot Maps Maps and Figures

Fig 7.a Flood Risk in Kassala State Kassala

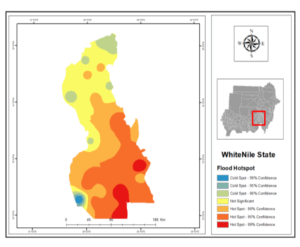
Floods Risks and Floods Hotspot Maps Maps and Figures

Fig 6.b Flood Hotspot in White Nile State White Nile

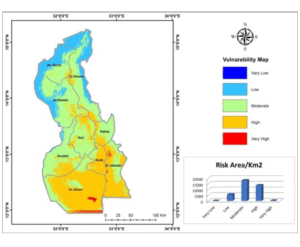
Floods Risks and Floods Hotspot Maps Maps and Figures

Fig 6.a Flood Risk in White Nile State White Nile

« Prev 1 … 4 5 6 7 8 … 15 Next »
    All Rights Reserved 2025.
    Proudly powered by WordPress | Theme: Refined Blocks by Candid Themes.