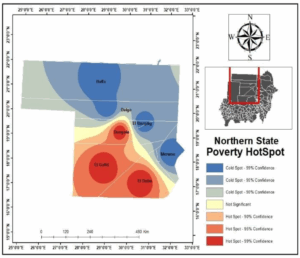
Maps and Figures Poverty Distribution and Hotspot Maps Fig 1b poverty Hotspot Map in Northern State The Northern
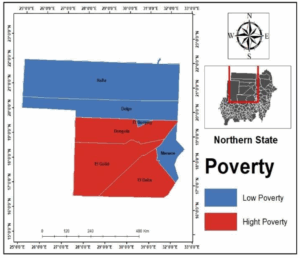
Maps and Figures Poverty Distribution and Hotspot Maps Fig 1a poverty Distribution in Northern State The Northern CONSTRUCTING CLIMATE CHANGE VULNERABILITY HOTSPOT MAPS (SPECIFIED IN LOA) REPORT ON: POVERTY DISTRIBUTION & HOTSPOT MAPPING PREPARED FOR FAO- SUDAN BY THE FACULTY OF GEOGRAPHICAL AND ENVIRONMENTAL SCIENCES UNIVERSITY OF KHARTOUM JANUARY, 2025
Floods Risks and Floods Hotspot Maps Maps and Figures Fig 18.b Flood Hotspot in Blue Nile State The Blue Nile
Floods Risks and Floods Hotspot Maps Maps and Figures Fig 18.a Flood Risk in Blue Nile State The Blue Nile
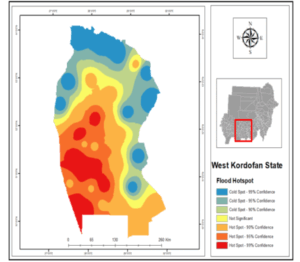
Floods Risks and Floods Hotspot Maps Maps and Figures Fig 17.b Flood Hotspot in West Kordofan state West Kordofan
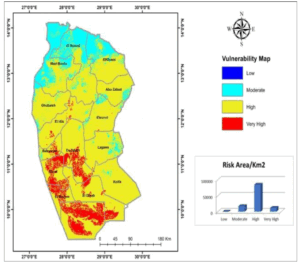
Floods Risks and Floods Hotspot Maps Maps and Figures Fig 17.a Flood Risk in West Kordofan State West Kordofan
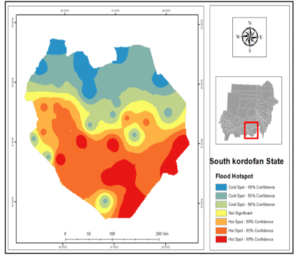
Floods Risks and Floods Hotspot Maps Maps and Figures Fig 16.b Flood Hotspot in South Kordofan state South Kordofan
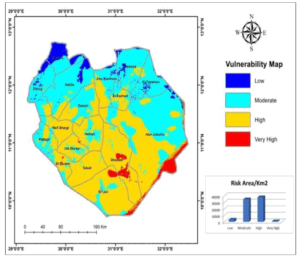
Floods Risks and Floods Hotspot Maps Maps and Figures Fig 16.a Flood Risk South Kordofan state South Kordofan