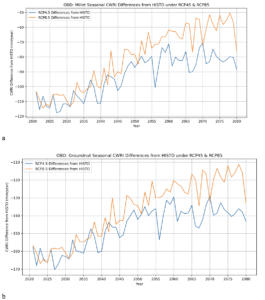
Crop Water Requirements Maps and Figures Figure 10 CWRI RCP4.5 and RCP8.5 values deviations from historical baseline period for (a) Millet and (b) Groundnut at OBD research station
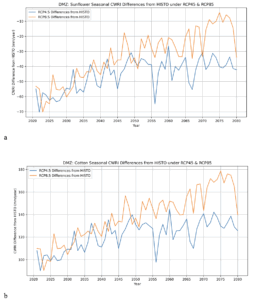
Crop Water Requirements Maps and Figures Figure 9 CWRI RCP4.5 and RCP8.5 values deviations from historical baseline period for (a) Sunflower and (b) Cotton at DMZ research station
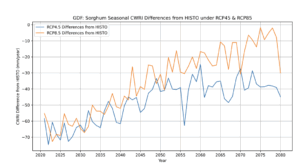
Crop Water Requirements Maps and Figures Figure 8 CWRI RCP4.5 and RCP8.5 values deviations from historical baseline period for Sorghum at GDF research station
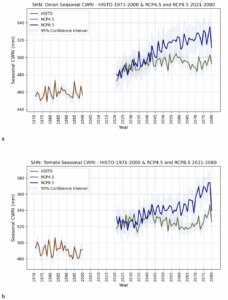
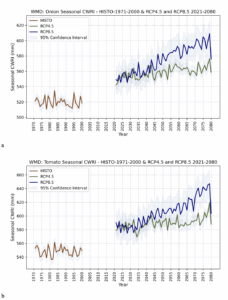
Crop Water Requirements Maps and Figures Figure 7 CWRI seasonal values for (a) Onion and (b) Tomato at SHN research station under HISTO, RCP4.5 and RCP8.5. Saddle brown, dark olive green and navy represents the historical, RCP4.5 and RCP8.5 CWRI (line), respectively. Geray color represents the shaded 95% Confident Intervals (CI) area
Crop Water Requirements Maps and Figures Figure 6 CWRI seasonal values for (a) Onion and (b) Tomato at WMD research station under HISTO, RCP4.5 and RCP8.5. Saddle brown, dark olive green and navy represents the historical, RCP4.5 and RCP8.5 CWRI (line), respectively. Geray color represents the shaded 95% Confident Intervals (CI) area
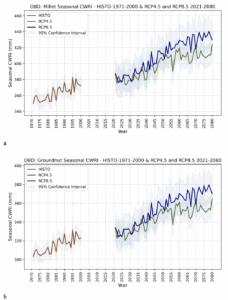
Crop Water Requirements Maps and Figures Figure 5 CWRI seasonal values for (a) Millet and (b) Groundnut at OBD research station under HISTO, RCP4.5 and RCP8.5. Saddle brown, dark olive green and navy represents the historical, RCP4.5 and RCP8.5 CWRI (line), respectively. Geray color represents the shaded 95% Confident Intervals (CI) area
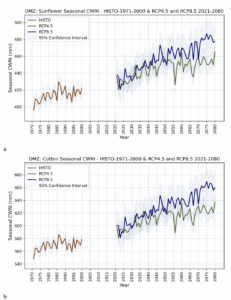
Crop Water Requirements Maps and Figures Figure 4 CWRI seasonal values for (a) Sunflower and (b) Cotton at DMZ research station under HISTO, RCP4.5 and RCP8.5. Saddle brown, dark olive green and navy represents the historical, RCP4.5 and RCP8.5 CWRI (line), respectively. Geray color represents the shaded 95% Confident Intervals (CI) area
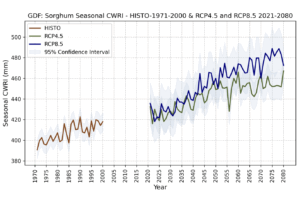
Crop Water Requirements Maps and Figures Figure 3 CWRI seasonal values for Sorghum at GDF research station under HISTO, RCP4.5 and RCP8.5. Saddle brown, dark olive green and navy represents the historical, RCP4.5 and RCP8.5 CWRI (line), respectively. Geray color represents the shaded 95% Confident Intervals (CI) area
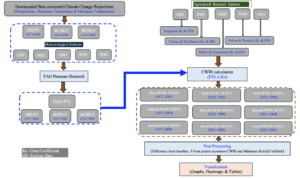
Crop Water Requirements Maps and Figures Figure 2 Flowchart of ETo data preparation and calculation using FAO Penman-Monteith method (left) and the data preparation for calculation of CWRI, post-processing and visualization processes. ETo and CWRI calculations based on downscaled bias-correction climate change scenarios (RCP4.5 and RCP8.5) for five selected crops and two vegetables from five agricultural research stations for the mid-term and long-term climate change projection periods
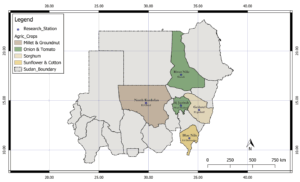
Crop Water Requirements Maps and Figures Figure 1 Geographical locations of the ARC research station that used in the studies along with the crops and vegetables that planed in each one and used in this study Assessment of Crop Water Requirement for the Main Production System in Sudan under Different Climate Change Scenarios Prepared by: Bashir Mohammed Ahmed1 Adil O. Salih1 Ammar Mokhtar Gomaha Gaber2 (1) Agricultural Research Corporation (ARC) (2) Food and Agriculture Organization of the United Nations (FAOSD) December 2024