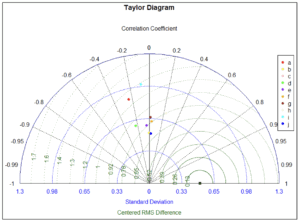
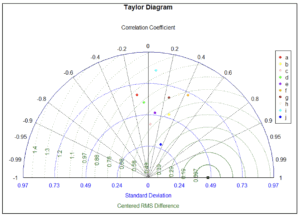
Downscaling Projections Maps and Figures Taylor diagram showing the validation Minimum temperature for the CORDEX RCA4 models against observed CRU data during the MAM season. The alphabetical letters represent a-CCCma, b-CNRM, c-CSIRO, d-IPSL, e-MIROC, f-MOHC, g-MPI, h-NCC, i-NOAA and, j-Ensemble
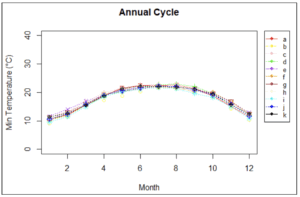
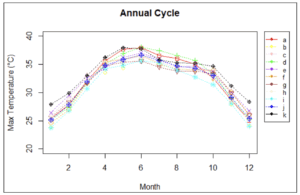
Downscaling Projections Maps and Figures Figure 8 Mean annual cycle of Minimum Temperature using the CRU and CORDEX RCA4 model datasets. The alphabetical letters represent a-CCCma, b-CNRM, c-CSIRO, d-IPSL, e-MIROC, f-MOHC, g-MPI, h-NCC, i-NOAA, j-Ensemble and k-CRU.
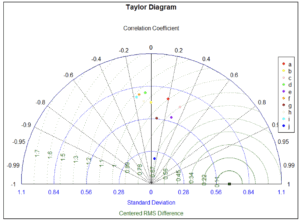
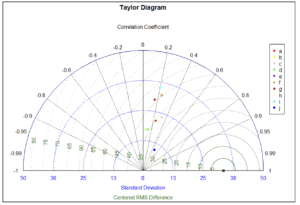
Downscaling Projections Maps and Figures Figure 7 Taylor diagram showing the validation Maximum temperature for the CORDEX RCA4 models against observed CRU data during the NDJF season. The alphabetical letters represent a-CCCma, b-CNRM, c-CSIRO, d-IPSL, e-MIROC, f-MOHC, g-MPI, h-NCC, i-NOAA and, j-Ensemble.
Downscaling Projections Maps and Figures Figure 6 Taylor diagram showing the validation Maximum temperature for the CORDEX RCA4 models against observed CRU data during the JJAS season. The alphabetical letters represent a-CCCma, b-CNRM, c-CSIRO, d-IPSL, e-MIROC, f-MOHC, g-MPI, h-NCC, i-NOAA and, j-Ensemble.
Downscaling Projections Maps and Figures Figure 5 Taylor diagram showing the validation Maximum temperature for the CORDEX RCA4 models against observed CRU data during the MAM season. The alphabetical letters represent a-CCCma, b-CNRM, c-CSIRO, d-IPSL, e-MIROC, f-MOHC, g-MPI, h-NCC, i-NOAA and, j-Ensemble.
Downscaling Projections Maps and Figures Figure 4 Mean annual cycle of Maximum Temperature using the CRU and CORDEX RCA4 model datasets. The alphabetical letters represent a-CCCma, b-CNRM, c-CSIRO, d-IPSL, e-MIROC, f-MOHC, g-MPI, h-NCC, i-NOAA, j-Ensemble and k-CRU.
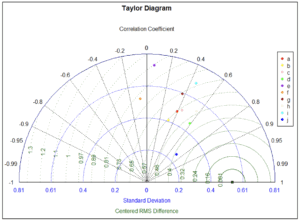
Downscaling Projections Maps and Figures Figure 3 Taylor diagram showing the validation rainfall for the CORDEX RCA4 models against observed CRU data during the JJAS season. The alphabetical letters represent a-CCCma, b-CNRM, c-CSIRO, d-IPSL, e-MIROC, f-MOHC, g-MPI, h-NCC, i-NOAA and, j-Ensemble
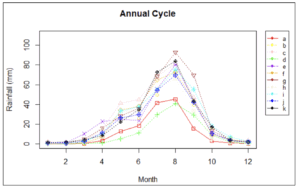
Downscaling Projections Maps and Figures Figure 2 Mean annual cycle of rainfall using the CRU and CORDEX RCA4 model datasets. The alphabetical letters represent a-CCCma, b-CNRM, c-CSIRO, d-IPSL, e-MIROC, f-MOHC, g-MPI, h-NCC, i-NOAA, j-Ensemble and k-CRU
Downscaling Projections Maps and Figures Figure 1 Location of stations used in the Study STRENGHTENING CLIMATE CHANGE ADAPTATION PLANNING IN THE SUDAN BASED ON UPDATED AND RELIABLE CLIMATE CHANGE DATA Prepared by: Dr. Jane Wangui Mugo (Climatologist) December 2021
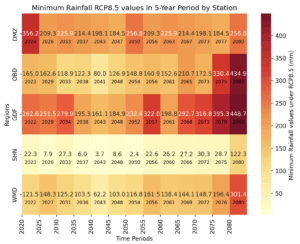
Crop Water Requirements Maps and Figures Figure 21 Heatmap of Rainfall minimum amounts in 5-Year return period for all meteorological stations for RCP8.5 Climate Change Scenario