Skip to content
Monday, August 18, 2025

NAP Readiness Project

NAP Readiness Project

  • About
    • About Project
    • Consultants
      • National
      • International
    • Partners
  • Activities
    • Federal Activities
    • States Activities
  • Documentation Library
    • Reports
    • Maps and Figures
    • Related Studies
  • Gallery
  • State Level
    • West Kordofan
    • South Kordofan
    • North Kordofan
    • El Gaziera
  • M&E
  • Contact Us
You are Here
  • Home
  • Maps and Figures
  • Downscaling Projections
  • Page 4

Category: Downscaling Projections

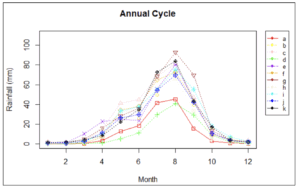
Downscaling Projections Maps and Figures

Figure 2 Mean annual cycle of rainfall using the CRU and CORDEX RCA4 model datasets. The alphabetical letters represent a-CCCma, b-CNRM, c-CSIRO, d-IPSL, e-MIROC, f-MOHC, g-MPI, h-NCC, i-NOAA, j-Ensemble and k-CRU

Downscaling Projections Maps and Figures

Figure 1 Location of stations used in the Study STRENGHTENING CLIMATE CHANGE ADAPTATION PLANNING IN THE SUDAN BASED ON UPDATED AND RELIABLE CLIMATE CHANGE DATA Prepared by: Dr. Jane Wangui Mugo (Climatologist) December 2021

« Prev 1 2 3 4
    All Rights Reserved 2025.
    Proudly powered by WordPress | Theme: Refined Blocks by Candid Themes.