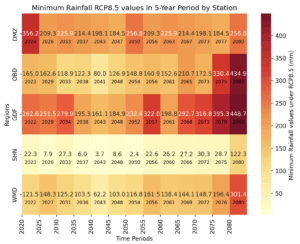
Crop Water Requirements Maps and Figures Figure 21 Heatmap of Rainfall minimum amounts in 5-Year return period for all meteorological stations for RCP8.5 Climate Change Scenario
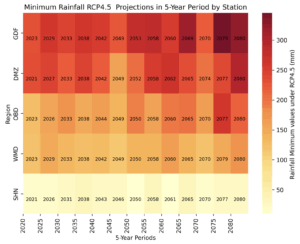
Crop Water Requirements Maps and Figures Figure 20 Heatmap of Rainfall minimum amounts in 5-Year return periods for all meteorological stations for RCP4.5 climate change scenario
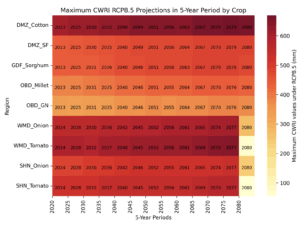
Crop Water Requirements Maps and Figures Figure 19 Heatmap shows the maximum CWRI values that occurred in the 5-Year period under RCP8.5 for the different crops at the five stations. The color indicates the values and number show the year that possesses the highest CWRI value during the period 2021-2080
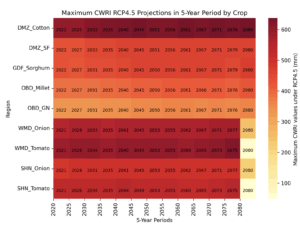
Crop Water Requirements Maps and Figures Figure 18 Heatmap shows the maximum CWRI values that occurred in the 5-Year period under RCP4.5 for the different crops at the five stations. The color indicates the values and number show the year that possesses the highest CWRI value during the period 2021-2080
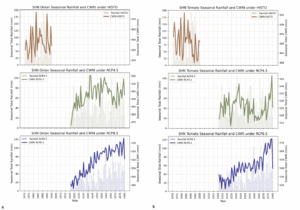
Crop Water Requirements Maps and Figures Figure 17 Variations of historical and projected seasonal Rainfall and CWRI values for (a) Onion at SHN research station over the periods 1971-2000 and 2021-2080, (b) Tomato at SHN station over the same periods. Saddle brown, dark olive green and navy represents the historical, RCP4.5 and RCP8.5 CWRI (line) and Rainfall (bar) values, respectively
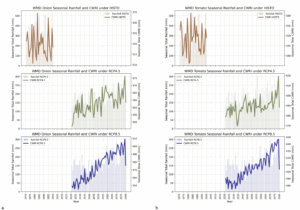
Crop Water Requirements Maps and Figures Figure 16 Variations of historical and projected seasonal Rainfall and CWRI values for (a) Onion at WMD station over the periods 1971-2000 and 2021-2080, (b) Tomato at WMD station over the same periods. Saddle brown, dark olive green and navy represents the historical, RCP4.5 and RCP8.5 CWRI (line) and Rainfall (bar) values, respectively
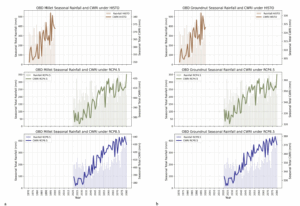
Crop Water Requirements Maps and Figures Figure 15 Variations of historical and projected seasonal Rainfall and CWRI values for (a) Millet at OBD station over the periods 1971-2000 and 2021-2080, (b) Groundnut at OBD station over the same periods. Saddle brown, dark olive green and navy represents the historical, RCP4.5 and RCP8.5 CWRI (line) and Rainfall (bar) values, respectively
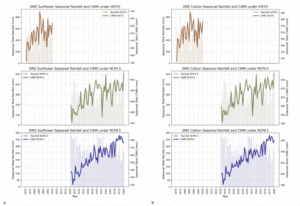
Crop Water Requirements Maps and Figures Figure 14 Variations of historical and projected seasonal Rainfall and CWRI values for (a) Sunflower at DMZ station over the periods 1971-2000 and 2021-2080, (b) Cotton at DMZ station over the same periods. Saddle brown, dark olive green and navy represents the historical, RCP4.5 and RCP8.5 CWRI (line) and Rainfall (bar) values, respectively
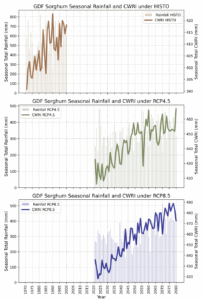
Crop Water Requirements Maps and Figures Figure 13 Variations of historical and projected seasonal Rainfall and CWRI values for Sorghum at GDF station over the periods 1971-2000 and 2021-2080. Saddle brown, dark olive green and navy represents the historical, RCP4.5 and RCP8.5 CWRI (line) and Rainfall (bar) values, respectively
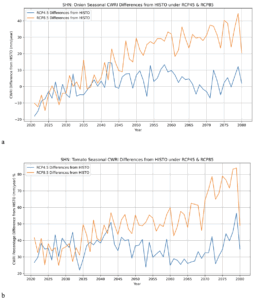
Crop Water Requirements Maps and Figures Figure 12 CWRI RCP4.5 and RCP8.5 values deviations from historical baseline period for (a) Onion and (b) Tomato at SHN research station