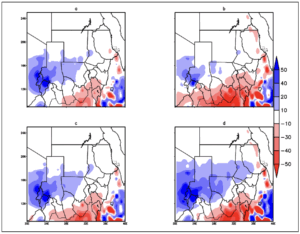
Figure 29 Difference plot of Rainfall during the NDJF season. Shades of red indicate decrease in rainfall amount while shades of blue indicate increase in rainfall amount. The alphabetical letters represent a- difference between the baseline and RCP 4.5 2021-2050 period, b- difference between the baseline and RCP 4.5 2051-2080 period, c- difference between the baseline and RCP 8.5 2021-2050 period, d- difference between the baseline and RCP 8.5 2051-2080 period
Figure 29 Difference plot of Rainfall during the NDJF season. Shades of red indicate decrease in rainfall amount while shades of blue indicate increase in rainfall amount. The alphabetical letters represent a- difference between the baseline and RCP 4.5 2021-2050 period, b- difference between the baseline and RCP 4.5 2051-2080 period, c- difference between the baseline and RCP 8.5 2021-2050 period, d- difference between the baseline and RCP 8.5 2051-2080 period