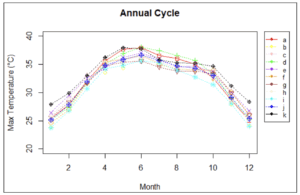
Figure 4 Mean annual cycle of Maximum Temperature using the CRU and CORDEX RCA4 model datasets. The alphabetical letters represent a-CCCma, b-CNRM, c-CSIRO, d-IPSL, e-MIROC, f-MOHC, g-MPI, h-NCC, i-NOAA, j-Ensemble and k-CRU.
Figure 4 Mean annual cycle of Maximum Temperature using the CRU and CORDEX RCA4 model datasets. The alphabetical letters represent a-CCCma, b-CNRM, c-CSIRO, d-IPSL, e-MIROC, f-MOHC, g-MPI, h-NCC, i-NOAA, j-Ensemble and k-CRU.