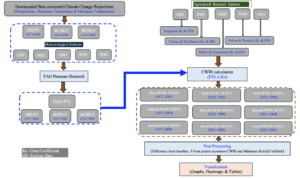
Figure 2 Flowchart of ETo data preparation and calculation using FAO Penman-Monteith method (left) and the data preparation for calculation of CWRI, post-processing and visualization processes. ETo and CWRI calculations based on downscaled bias-correction climate change scenarios (RCP4.5 and RCP8.5) for five selected crops and two vegetables from five agricultural research stations for the mid-term and long-term climate change projection periods
Figure 2 Flowchart of ETo data preparation and calculation using FAO Penman-Monteith method (left) and the data preparation for calculation of CWRI, post-processing and visualization processes. ETo and CWRI calculations based on downscaled bias-correction climate change scenarios (RCP4.5 and RCP8.5) for five selected crops and two vegetables from five agricultural research stations for the mid-term and long-term climate change projection periods