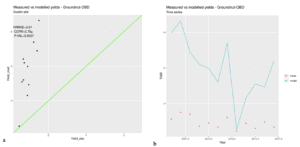
Figure 20 a) Scatter plot of the actual (historically measured) and modeled yield for Groundnut at El Obied research station. The x-axis represents observed yields (Yield_obs), and the y-axis represents modelled yields (Yield_mod). The green line represents the ideal 1:1 relationship where modelled yields perfectly match observed yields
Figure 20 a) Scatter plot of the actual (historically measured) and modeled yield for Groundnut at El Obied research station. The x-axis represents observed yields (Yield_obs), and the y-axis represents modelled yields (Yield_mod). The green line represents the ideal 1:1 relationship where modelled yields perfectly match observed yields