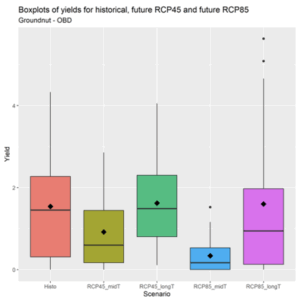
Figure 18 Distribution of modelled groundnut yields at El Obied for the historical period, for the mid-term future (2021-2050) and long-term future (2051-2080). Future yields are simulated for emission scenarios 4.5 and 8.5. The black point within the boxplot represents the mean value
Figure 18 Distribution of modelled groundnut yields at El Obied for the historical period, for the mid-term future (2021-2050) and long-term future (2051-2080). Future yields are simulated for emission scenarios 4.5 and 8.5. The black point within the boxplot represents the mean value