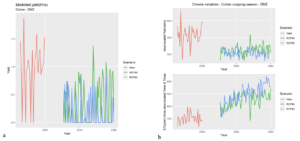
Figure 16 a) Time series of modeled Cotton yields at Ed Damazine for the historical period and future period (2021-2080) under the two scenarios RCP 4.5 and RCP 8.5. (b) time series of downscaled climate variables, for the same periods and the same scenarios. (Top) rainfall in mm & (bottom) Reference Evapotranspiration (ETo mm/day). Climate variables are averaged over the growing season. Red, green and blue colors depict the historical, RCP4.5 and RCP8.5 periods, respectively
Figure 16 a) Time series of modeled Cotton yields at Ed Damazine for the historical period and future period (2021-2080) under the two scenarios RCP 4.5 and RCP 8.5. (b) time series of downscaled climate variables, for the same periods and the same scenarios. (Top) rainfall in mm & (bottom) Reference Evapotranspiration (ETo mm/day). Climate variables are averaged over the growing season. Red, green and blue colors depict the historical, RCP4.5 and RCP8.5 periods, respectively