Skip to content
Monday, August 18, 2025

NAP Readiness Project

NAP Readiness Project

  • About
    • About Project
    • Consultants
      • National
      • International
    • Partners
  • Activities
    • Federal Activities
    • States Activities
  • Documentation Library
    • Reports
    • Maps and Figures
    • Related Studies
  • Gallery
  • State Level
    • West Kordofan
    • South Kordofan
    • North Kordofan
    • El Gaziera
  • M&E
  • Contact Us
You are Here
  • Home
  • 2025
  • August
  • 3
  • Figure 7 The total annual production of tomatoes in Sudan for the period 2012-2021
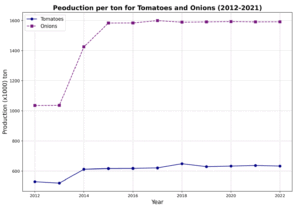
Crop Simulation Maps and Figures

Figure 7 The total annual production of tomatoes in Sudan for the period 2012-2021

Post navigation

Figure 6 The total annual harvested areas and total annual production of onion in Sudan during the period 2011-2020
The part of the reality that is described by AquaCrop. AquaCrop Training Handbook. Book I: Understanding AquaCrop. https://www.fao.org/aquacrop/software/ aquacropstandardwindowsprogramme/en/#c522959
    All Rights Reserved 2025.
    Proudly powered by WordPress | Theme: Refined Blocks by Candid Themes.