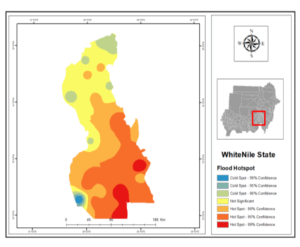
Floods Risks and Floods Hotspot Maps Maps and Figures Fig 6.b Flood Hotspot in White Nile State White Nile
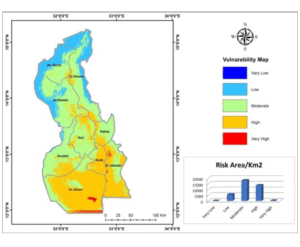
Floods Risks and Floods Hotspot Maps Maps and Figures Fig 6.a Flood Risk in White Nile State White Nile
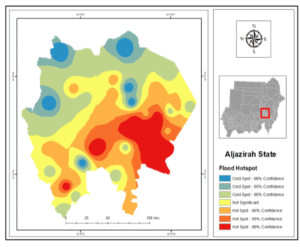
Floods Risks and Floods Hotspot Maps Maps and Figures Fig 5.b Flood Hotspot in Al Gazera State Al Gazera
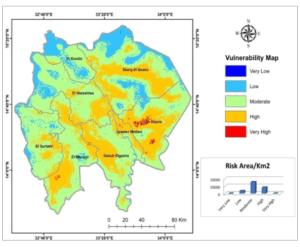
Floods Risks and Floods Hotspot Maps Maps and Figures Fig 5.a Flood Risk in Al Gazera State Al Gazera
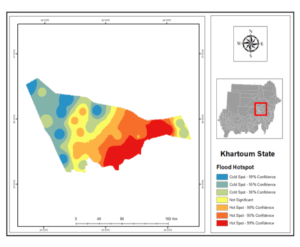
Floods Risks and Floods Hotspot Maps Maps and Figures Fig 4.b Flood Hotspot in Khartoum State Khartoum
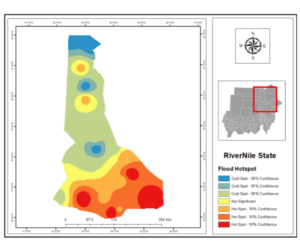
Floods Risks and Floods Hotspot Maps Maps and Figures Fig 3.b Flood Hotspot in River Nile State The River Nile