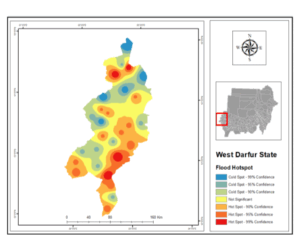
Floods Risks and Floods Hotspot Maps Maps and Figures Fig 13.b Flood Hotspot in West Darfur State West Darfur
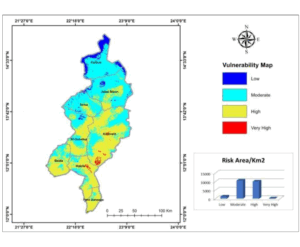
Floods Risks and Floods Hotspot Maps Maps and Figures Fig 13.a Flood Risk in West Darfur State West Darfur
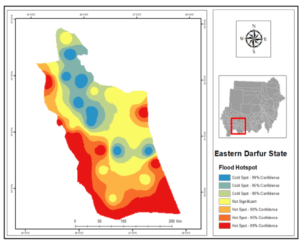
Floods Risks and Floods Hotspot Maps Maps and Figures Fig 12.b Flood Hotspot in Eastern Darfur State Eastern Darfur
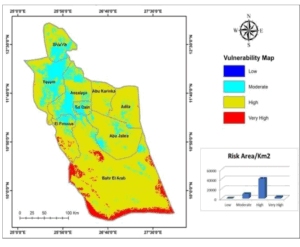
Floods Risks and Floods Hotspot Maps Maps and Figures Fig 12.a Flood Risk in Eastern Darfur State Eastern Darfur
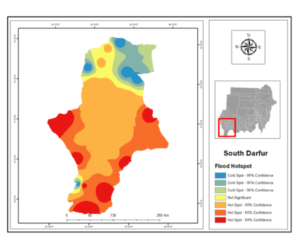
Floods Risks and Floods Hotspot Maps Maps and Figures Fig 11.b Flood Hotspot in South Darfur State South Darfur
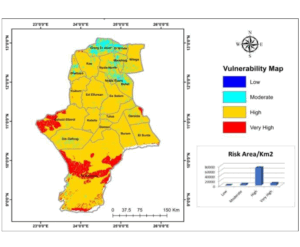
Floods Risks and Floods Hotspot Maps Maps and Figures Fig 11.a Flood Risk in South Darfur State South Darfur
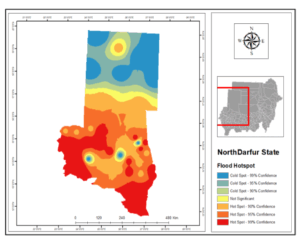
Floods Risks and Floods Hotspot Maps Maps and Figures Fig 10.b Flood Hotspot in North Darfur State North Darfur
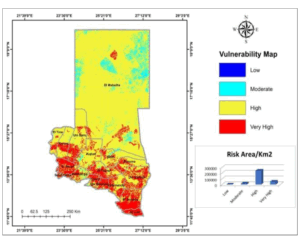
Floods Risks and Floods Hotspot Maps Maps and Figures Fig 10.a Flood Risk in North Darfur State North Darfur
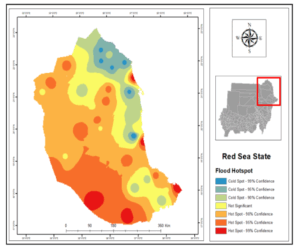
Floods Risks and Floods Hotspot Maps Maps and Figures Fig 9.b Flood Hotspot in Red Sea State The Red Sea
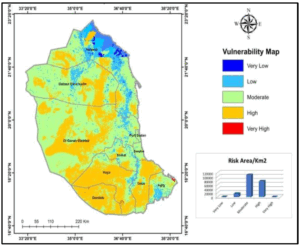
Floods Risks and Floods Hotspot Maps Maps and Figures Fig 9.a Flood Risk in Red Sea State The Red Sea