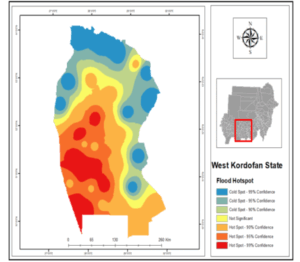
Floods Risks and Floods Hotspot Maps Maps and Figures Fig 17.b Flood Hotspot in West Kordofan state West Kordofan
Floods Risks and Floods Hotspot Maps Maps and Figures Fig 17.a Flood Risk in West Kordofan State West Kordofan
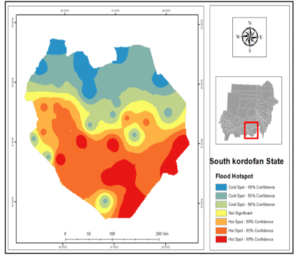
Floods Risks and Floods Hotspot Maps Maps and Figures Fig 16.b Flood Hotspot in South Kordofan state South Kordofan
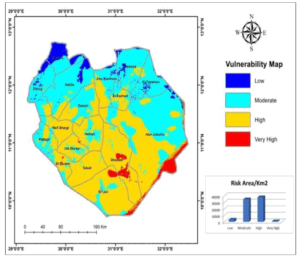
Floods Risks and Floods Hotspot Maps Maps and Figures Fig 16.a Flood Risk South Kordofan state South Kordofan
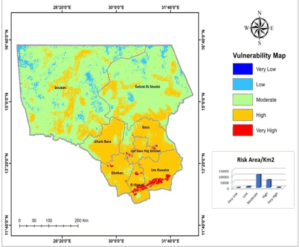
Floods Risks and Floods Hotspot Maps Maps and Figures Fig 15.b Flood Risk in South Kordofan state North Kordofan
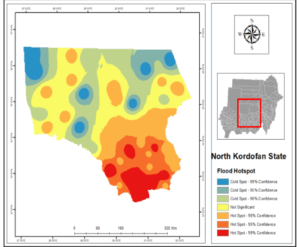
Floods Risks and Floods Hotspot Maps Maps and Figures Fig 15.a Flood Hotspot in North Kordofan state North Kordofan
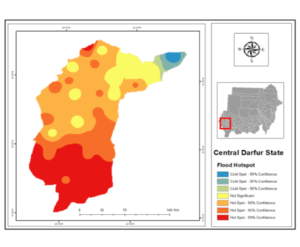
Floods Risks and Floods Hotspot Maps Maps and Figures Fig 14.b Flood Hotspot in Central Darfur State Central Darfur
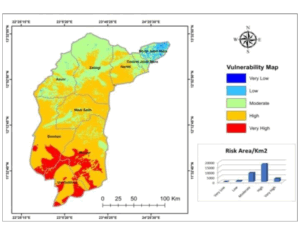
Floods Risks and Floods Hotspot Maps Maps and Figures Fig 14.a Flood Risk in Central Darfur State Central Darfur