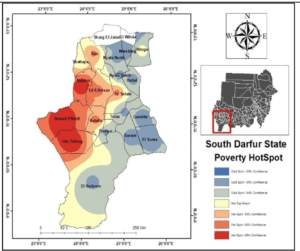
Maps and Figures Poverty Distribution and Hotspot Maps Fig 10b Poverty Hotspot Map in South Darfur State South Darfur
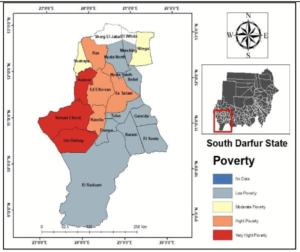
Maps and Figures Poverty Distribution and Hotspot Maps Fig 10a Poverty Distribution in South Darfur State South Darfur
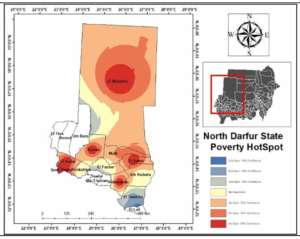
Maps and Figures Poverty Distribution and Hotspot Maps Fig 9b Poverty Hotspot Map in North Darfur State North Darfur
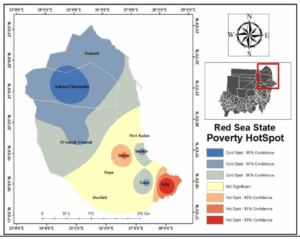
Maps and Figures Poverty Distribution and Hotspot Maps Fig 8b Poverty Hotspot Map in Red Sea State The Red Sea
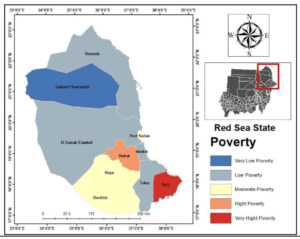
Maps and Figures Poverty Distribution and Hotspot Maps Fig 8a Poverty Distribution in Red Sea State The Red Sea
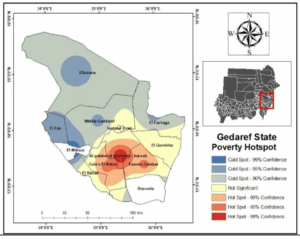
Maps and Figures Poverty Distribution and Hotspot Maps Fig 7b Poverty Hotspot Map in Gedaref State Gadarif
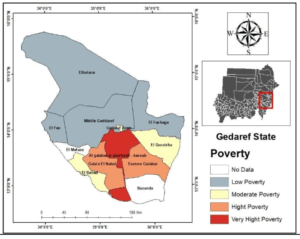
Maps and Figures Poverty Distribution and Hotspot Maps Fig 7a Poverty Distribution in Gedaref State Gadarif
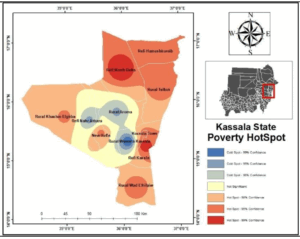
Maps and Figures Poverty Distribution and Hotspot Maps Fig 6b Poverty Hotspot Map in Kassala State Kassala
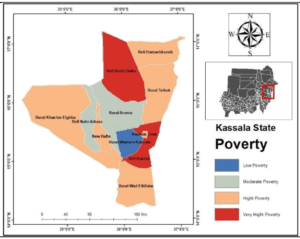
Maps and Figures Poverty Distribution and Hotspot Maps Fig 6a Poverty Distribution in Kassala State Kassala
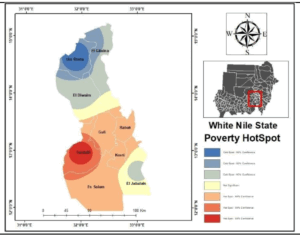
Maps and Figures Poverty Distribution and Hotspot Maps Fig 5b Poverty Hotspot Map in White Nile State White Nile