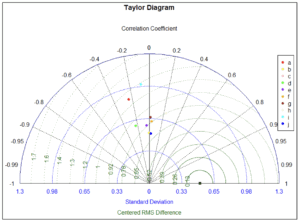
Taylor diagram showing the validation Minimum temperature for the CORDEX RCA4 models against observed CRU data during the MAM season. The alphabetical letters represent a-CCCma, b-CNRM, c-CSIRO, d-IPSL, e-MIROC, f-MOHC, g-MPI, h-NCC, i-NOAA and, j-Ensemble
Taylor diagram showing the validation Minimum temperature for the CORDEX RCA4 models against observed CRU data during the MAM season. The alphabetical letters represent a-CCCma, b-CNRM, c-CSIRO, d-IPSL, e-MIROC, f-MOHC, g-MPI, h-NCC, i-NOAA and, j-Ensemble