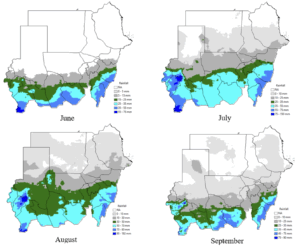
Figure 3 Distribution of the monthly rainfall (June, July, August and September) normal rainfall over the climatological period 1991-2020. Source: Climate Hazard Group InfraRed Precipitation with Satellite CHIRPS dataset (www.chc.ucsb.edu/products/CHIRPS-2.0/).
Figure 3 Distribution of the monthly rainfall (June, July, August and September) normal rainfall over the climatological period 1991-2020. Source: Climate Hazard Group InfraRed Precipitation with Satellite CHIRPS dataset (www.chc.ucsb.edu/products/CHIRPS-2.0/).