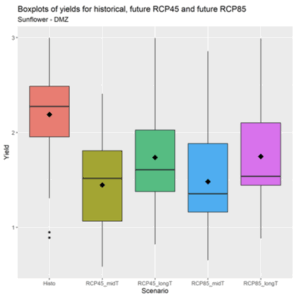
Figure 21 Boxplots of modelled sunflower yields at Ed Damazine for the historical period, for the mid-term future (2021-2050) and long-term future (2051-2080). Future yields are simulated for emission scenarios 4.5 and 8.5. The black point within the boxplot represents the mean value
Figure 21 Boxplots of modelled sunflower yields at Ed Damazine for the historical period, for the mid-term future (2021-2050) and long-term future (2051-2080). Future yields are simulated for emission scenarios 4.5 and 8.5. The black point within the boxplot represents the mean value