Skip to content
Monday, August 18, 2025

NAP Readiness Project

NAP Readiness Project

  • About
    • About Project
    • Consultants
      • National
      • International
    • Partners
  • Activities
    • Federal Activities
    • States Activities
  • Documentation Library
    • Reports
    • Maps and Figures
    • Related Studies
  • Gallery
  • State Level
    • West Kordofan
    • South Kordofan
    • North Kordofan
    • El Gaziera
  • M&E
  • Contact Us
You are Here
  • Home
  • 2025
  • August
  • 3
  • Figure 20 Heatmap of Rainfall minimum amounts in 5-Year return periods for all meteorological stations for RCP4.5 climate change scenario
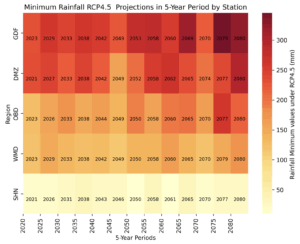
Crop Water Requirements Maps and Figures

Figure 20 Heatmap of Rainfall minimum amounts in 5-Year return periods for all meteorological stations for RCP4.5 climate change scenario

Post navigation

Figure 19 Heatmap shows the maximum CWRI values that occurred in the 5-Year period under RCP8.5 for the different crops at the five stations. The color indicates the values and number show the year that possesses the highest CWRI value during the period 2021-2080
Figure 21 Heatmap of Rainfall minimum amounts in 5-Year return period for all meteorological stations for RCP8.5 Climate Change Scenario
    All Rights Reserved 2025.
    Proudly powered by WordPress | Theme: Refined Blocks by Candid Themes.