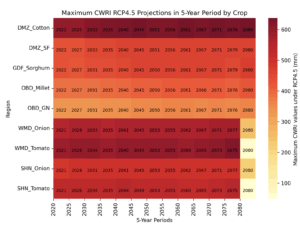
Figure 18 Heatmap shows the maximum CWRI values that occurred in the 5-Year period under RCP4.5 for the different crops at the five stations. The color indicates the values and number show the year that possesses the highest CWRI value during the period 2021-2080
Figure 18 Heatmap shows the maximum CWRI values that occurred in the 5-Year period under RCP4.5 for the different crops at the five stations. The color indicates the values and number show the year that possesses the highest CWRI value during the period 2021-2080