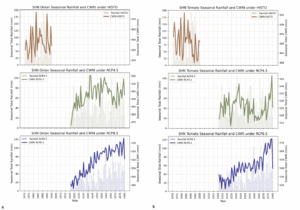
Figure 17 Variations of historical and projected seasonal Rainfall and CWRI values for (a) Onion at SHN research station over the periods 1971-2000 and 2021-2080, (b) Tomato at SHN station over the same periods. Saddle brown, dark olive green and navy represents the historical, RCP4.5 and RCP8.5 CWRI (line) and Rainfall (bar) values, respectively
Figure 17 Variations of historical and projected seasonal Rainfall and CWRI values for (a) Onion at SHN research station over the periods 1971-2000 and 2021-2080, (b) Tomato at SHN station over the same periods. Saddle brown, dark olive green and navy represents the historical, RCP4.5 and RCP8.5 CWRI (line) and Rainfall (bar) values, respectively