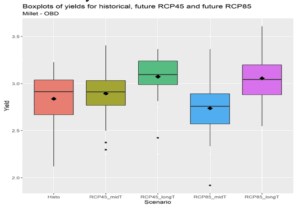
Figure 12 Distributions of projections of future Millet yields under medium-term (RCP4.5_midT & RCP8.5_midT) and long-term (RCP4.5_longT and RCP8.5_longT) climate change scenarios for El Obied. Historical simulation is also shown in the boxplot graphs
Figure 12 Distributions of projections of future Millet yields under medium-term (RCP4.5_midT & RCP8.5_midT) and long-term (RCP4.5_longT and RCP8.5_longT) climate change scenarios for El Obied. Historical simulation is also shown in the boxplot graphs