Skip to content
Monday, August 18, 2025

NAP Readiness Project

NAP Readiness Project

  • About
    • About Project
    • Consultants
      • National
      • International
    • Partners
  • Activities
    • Federal Activities
    • States Activities
  • Documentation Library
    • Reports
    • Maps and Figures
    • Related Studies
  • Gallery
  • State Level
    • West Kordofan
    • South Kordofan
    • North Kordofan
    • El Gaziera
  • M&E
  • Contact Us
You are Here
  • Home
  • 2025
  • August
  • 3
  • Figure 12 CWRI RCP4.5 and RCP8.5 values deviations from historical baseline period for (a) Onion and (b) Tomato at SHN research station
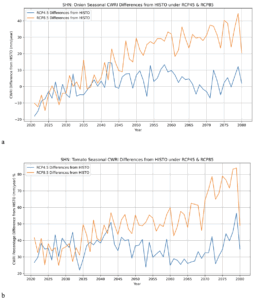
Crop Water Requirements Maps and Figures

Figure 12 CWRI RCP4.5 and RCP8.5 values deviations from historical baseline period for (a) Onion and (b) Tomato at SHN research station

Post navigation

Figure 11 CWRI RCP4.5 and RCP8.5 values deviations from historical baseline period for (a) Onion and (b) Tomato at WMD research station
Figure 13 Variations of historical and projected seasonal Rainfall and CWRI values for Sorghum at GDF station over the periods 1971-2000 and 2021-2080. Saddle brown, dark olive green and navy represents the historical, RCP4.5 and RCP8.5 CWRI (line) and Rainfall (bar) values, respectively
    All Rights Reserved 2025.
    Proudly powered by WordPress | Theme: Refined Blocks by Candid Themes.